1. 基本知识
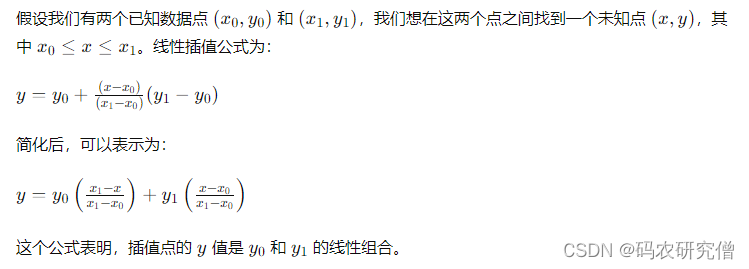
简单且常用的插值方法,主要用于在两个已知数据点之间进行插值
其基本思想是假设两个数据点之间的变化是线性的,从而可以通过计算两个数据点之间的线性方程来估计中间点的值
基本的理论知识如下:

2. Demo
2.1 基本线性插值
def linear_interpolate(x0, y0, x1, y1, x):
    """
    计算在点 (x0, y0) 和 (x1, y1) 之间,x 处的 y 值。

    参数:
    x0, y0 - 第一个已知点的坐标
    x1, y1 - 第二个已知点的坐标
    x - 需要插值的 x 坐标

    返回:
    插值点的 y 值
    """
    y = y0 + (x - x0) * (y1 - y0) / (x1 - x0)
    return y

# 示例数据点
x0, y0 = 1, 2
x1, y1 = 3, 3
x = 2

# 进行插值计算
y = linear_interpolate(x0, y0, x1, y1, x)
print(f"在 x = {x} 处的插值 y 值为: {y}")
截图如下:

2.2 多个数据插值
import numpy as np
import matplotlib.pyplot as plt

# 示例数据点
x_points = [0, 1, 2, 3, 4]
y_points = [0, 2, 4, 6, 8]

def linear_interpolate(x0, y0, x1, y1, x):
    """
    计算在点 (x0, y0) 和 (x1, y1) 之间,x 处的 y 值。

    参数:
    x0, y0 - 第一个已知点的坐标
    x1, y1 - 第二个已知点的坐标
    x - 需要插值的 x 坐标

    返回:
    插值点的 y 值
    """
    y = y0 + (x - x0) * (y1 - y0) / (x1 - x0)
    return y

def interpolate(x_points, y_points, x):
    """
    在一组数据点之间进行线性插值。

    参数:
    x_points - x 坐标的列表
    y_points - y 坐标的列表
    x - 需要插值的 x 坐标

    返回:
    插值点的 y 值
    """
    for i in range(len(x_points) - 1):
        if x_points[i] <= x <= x_points[i + 1]:
            return linear_interpolate(x_points[i], y_points[i], x_points[i + 1], y_points[i + 1], x)
    return None

# 插值点
x_new = np.linspace(0, 4, 100)
y_new = [interpolate(x_points, y_points, xi) for xi in x_new]

# 绘制结果
plt.plot(x_points, y_points, 'o', label='原始数据点')
plt.plot(x_new, y_new, '-', label='插值曲线')
plt.legend()
plt.show()
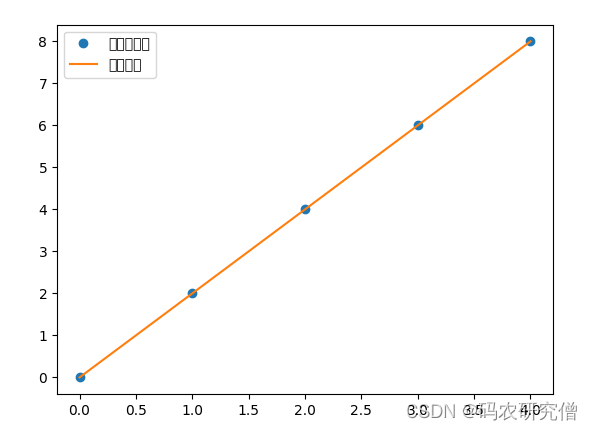
截图如下:

更换下数据:
import numpy as np
import matplotlib.pyplot as plt

# 示例数据点
x_points = [2, 4, 6, 8, 10, 12, 14, 16, 18, 20]
y_points = [4, 7, 11, 16, 22, 29, 38, 49, 63, 80]

def linear_interpolate(x0, y0, x1, y1, x):
    """
    计算在点 (x0, y0) 和 (x1, y1) 之间,x 处的 y 值。

    参数:
    x0, y0 - 第一个已知点的坐标
    x1, y1 - 第二个已知点的坐标
    x - 需要插值的 x 坐标

    返回:
    插值点的 y 值
    """
    y = y0 + (x - x0) * (y1 - y0) / (x1 - x0)
    return y

def interpolate(x_points, y_points, x):
    """
    在一组数据点之间进行线性插值。

    参数:
    x_points - x 坐标的列表
    y_points - y 坐标的列表
    x - 需要插值的 x 坐标

    返回:
    插值点的 y 值
    """
    for i in range(len(x_points) - 1):
        if x_points[i] <= x <= x_points[i + 1]:
            return linear_interpolate(x_points[i], y_points[i], x_points[i + 1], y_points[i + 1], x)
    return None

# 插值点
x_new = np.linspace(2, 20, 100)  # 修改为在数据点范围内进行插值
y_new = [interpolate(x_points, y_points, xi) for xi in x_new]

# 绘制结果
plt.plot(x_points, y_points, '-ob', label='原始数据点')
plt.plot(x_new, y_new, 'ro', label='插值曲线')
plt.legend()
plt.show()
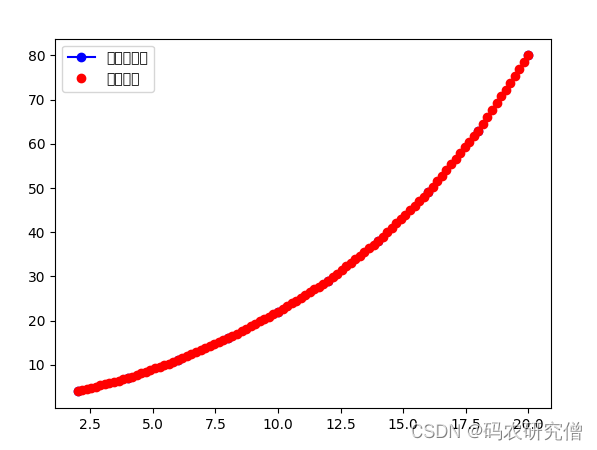
截图如下:

如果想标记插值的点:
import numpy as np
import matplotlib.pyplot as plt

# 示例数据点
x_points = [2, 4, 6, 8, 10, 12, 14, 16, 18, 20]
y_points = [4, 7, 11, 16, 22, 29, 38, 49, 63, 80]

def linear_interpolate(x0, y0, x1, y1, x):
    """
    计算在点 (x0, y0) 和 (x1, y1) 之间,x 处的 y 值。

    参数:
    x0, y0 - 第一个已知点的坐标
    x1, y1 - 第二个已知点的坐标
    x - 需要插值的 x 坐标

    返回:
    插值点的 y 值
    """
    y = y0 + (x - x0) * (y1 - y0) / (x1 - x0)
    return y

def interpolate(x_points, y_points, x):
    """
    在一组数据点之间进行线性插值。

    参数:
    x_points - x 坐标的列表
    y_points - y 坐标的列表
    x - 需要插值的 x 坐标

    返回:
    插值点的 y 值
    """
    for i in range(len(x_points) - 1):
        if x_points[i] <= x <= x_points[i + 1]:
            return linear_interpolate(x_points[i], y_points[i], x_points[i + 1], y_points[i + 1], x)
    return None

# 计算插值点
x_interp = 13
y_interp = interpolate(x_points, y_points, x_interp)

# 插值点
x_new = np.linspace(2, 20, 100)
y_new = [interpolate(x_points, y_points, xi) for xi in x_new]

# 绘制结果
plt.plot(x_points, y_points, '-ob', label='原始数据点')
plt.plot(x_new, y_new, 'r-', label='插值曲线')
plt.plot(x_interp, y_interp, 'go', label=f'插值点 ({x_interp}, {y_interp:.1f})')
plt.legend()
plt.xlabel('x')
plt.ylabel('y')
plt.title('线性插值示例')
plt.show()

# 输出插值点
print(f"插值点 ({x_interp}, {y_interp:.1f})")
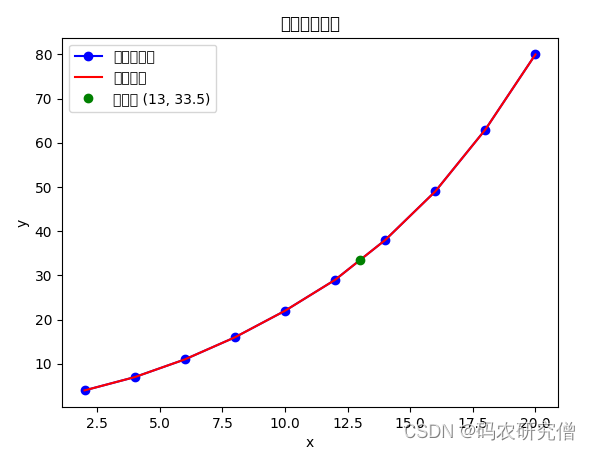
截图如下:

2.3 二维线性插值
def bilinear_interpolate(x, y, points):
    """
    执行二维线性插值。

    参数:
    x, y - 插值点的 x 和 y 坐标
    points - 四个已知点的坐标和值 [(x0, y0, z0), (x1, y0, z1), (x0, y1, z2), (x1, y1, z3)]

    返回:
    插值点的 z 值
    """
    # 确保 points 包含四个点
    if len(points) != 4:
        raise ValueError("需要提供四个点的坐标和值")

    # 解包点的坐标和值
    (x0, y0, z0), (x1, y0, z1), (x0_2, y1, z2), (x1_2, y1_2, z3) = points

    # 检查点是否构成矩形
    if not (x0 == x0_2 and x1 == x1_2 and y0 == y0 and y1 == y1_2 and x0 < x1 and y0 < y1):
        print(f"输入点不构成矩形: {points}")
        raise ValueError("点必须构成一个矩形,并且 x 和 y 值分别不同")

    # 在 x 方向上进行插值
    z0_interp = z0 + (x - x0) * (z1 - z0) / (x1 - x0)
    z1_interp = z2 + (x - x0) * (z3 - z2) / (x1 - x0)

    # 在 y 方向上进行插值
    z_interp = z0_interp + (y - y0) * (z1_interp - z0_interp) / (y1 - y0)

    return z_interp

# 示例数据点
points = [(1, 1, 1), (2, 1, 2), (1, 2, 3), (2, 2, 4)]
x, y = 1.5, 1.5

# 进行插值计算
try:
    z = bilinear_interpolate(x, y, points)
    print(f"在 (x, y) = ({x}, {y}) 处的插值 z 值为: {z}")
except ValueError as e:
    print(e)
截图如下:


