当发现程序运行性能比较差,同时CPU利用率又低.那么说明CPU不是影响性能的因素.
那CPU利用率低,主要原因是因为软件出现了等待并退出线程执行进入睡眠状态.
同理,对于软件本应该在预计时间内完成的某个事务,却消耗了超过预期的时间,同时CPU使用率正常(非100%),那么需要定位是否有软件出现了等待并退出线程执行进入睡眠状态.
那么如何抓取到所有的线程等待事件呢? 如下所示:
首先, Linux内核线程调度模块暴露了调试接口如下:
ls /sys/kernel/debug/tracing/events/sched
enable
filter
sched_kthread_stop
sched_kthread_stop_ret
sched_migrate_task
sched_move_numa
sched_pi_setprio
sched_process_exec
sched_process_exit
sched_process_fork
sched_process_free
sched_process_hang
sched_process_wait
sched_stat_blocked
sched_stat_iowait
sched_stat_runtime
sched_stat_sleep
sched_stat_wait
sched_stick_numa
sched_swap_numa
sched_switch
sched_wait_task
sched_wake_idle_without_ipi
sched_wakeup
sched_wakeup_new
sched_waking
在内核include/trace/events/sched.h中,有sched_switch tracepoint
/*
 * Tracepoint for task switches, performed by the scheduler:
 */
TRACE_EVENT(sched_switch,

	TP_PROTO(bool preempt,
		 struct task_struct *prev,
		 struct task_struct *next,
		 unsigned int prev_state),

	TP_ARGS(preempt, prev, next, prev_state),

	TP_STRUCT__entry(
		__array(	char,	prev_comm,	TASK_COMM_LEN	)
		__field(	pid_t,	prev_pid			)
		__field(	int,	prev_prio			)
		__field(	long,	prev_state			)
		__array(	char,	next_comm,	TASK_COMM_LEN	)
		__field(	pid_t,	next_pid			)
		__field(	int,	next_prio			)
	),

	TP_fast_assign(
		memcpy(__entry->next_comm, next->comm, TASK_COMM_LEN);
		__entry->prev_pid	= prev->pid;
		__entry->prev_prio	= prev->prio;
		__entry->prev_state	= __trace_sched_switch_state(preempt, prev_state, prev);
		memcpy(__entry->prev_comm, prev->comm, TASK_COMM_LEN);
		__entry->next_pid	= next->pid;
		__entry->next_prio	= next->prio;
		/* XXX SCHED_DEADLINE */
	),

	TP_printk("prev_comm=%s prev_pid=%d prev_prio=%d prev_state=%s%s ==> next_comm=%s next_pid=%d next_prio=%d",
		__entry->prev_comm, __entry->prev_pid, __entry->prev_prio,

		(__entry->prev_state & (TASK_REPORT_MAX - 1)) ?
		  __print_flags(__entry->prev_state & (TASK_REPORT_MAX - 1), "|",
				{ TASK_INTERRUPTIBLE, "S" },
				{ TASK_UNINTERRUPTIBLE, "D" },
				{ __TASK_STOPPED, "T" },
				{ __TASK_TRACED, "t" },
				{ EXIT_DEAD, "X" },
				{ EXIT_ZOMBIE, "Z" },
				{ TASK_PARKED, "P" },
				{ TASK_DEAD, "I" }) :
		  "R",

		__entry->prev_state & TASK_REPORT_MAX ? "+" : "",
		__entry->next_comm, __entry->next_pid, __entry->next_prio)
);
在linux kernel/sched/core.c中,函数__schedule调用了上述tracepoint sched_switch:
trace_sched_switch(sched_mode & SM_MASK_PREEMPT, prev, next, prev_state);
并且在内核include/trace/events/sched.h中存在sched_wakeup, sched_wakeup_new, sched_waking这3种唤醒tracepoint如下:
/*
 * Tracepoint called when waking a task; this tracepoint is guaranteed to be
 * called from the waking context.
 */
DEFINE_EVENT(sched_wakeup_template, sched_waking,
	     TP_PROTO(struct task_struct *p),
	     TP_ARGS(p));

/*
 * Tracepoint called when the task is actually woken; p->state == TASK_RUNNING.
 * It is not always called from the waking context.
 */
DEFINE_EVENT(sched_wakeup_template, sched_wakeup,
	     TP_PROTO(struct task_struct *p),
	     TP_ARGS(p));

/*
 * Tracepoint for waking up a new task:
 */
DEFINE_EVENT(sched_wakeup_template, sched_wakeup_new,
	     TP_PROTO(struct task_struct *p),
	     TP_ARGS(p));
他们在linux kernel/sched/core.c中的函数ttwu_do_wakeup()和wake_up_new_task()被调用。
所以只需要抓取上述tracepoint,就能得到对应的线程调度信息,并且抓取过程对系统性能影响极小。
抓取方法:
执行:perf record -e sched:sched_switch -e sched:sched_wakeup -ag
停止:ctrl+c
解析:perf script
得到如下结果,可以看到,因为perf record加了-g参数,所以保存了tracepoint的callstack,便于查找问题。
iperf 16110 [005] 68874.524153: sched:sched_switch: prev_comm=iperf prev_pid=16110 prev_prio=120 prev_state=S ==> next_comm=swapper/5 next_pid=0 next_prio=120
ffffff8008972be0 __schedule ([kernel.kallsyms])
ffffff8008972be0 __schedule ([kernel.kallsyms])
ffffff800897305c schedule ([kernel.kallsyms])
ffffff8008975da0 schedule_timeout ([kernel.kallsyms])
ffffff80087e5830 sock_alloc_send_pskb ([kernel.kallsyms])
ffffff80087e5948 sock_alloc_send_skb ([kernel.kallsyms])
ffffff800888972c __ip_append_data ([kernel.kallsyms])
ffffff800888a4bc ip_make_skb ([kernel.kallsyms])
ffffff80088b8578 udp_sendmsg ([kernel.kallsyms])
ffffff80088c4cac inet_sendmsg ([kernel.kallsyms])
ffffff80087dc1ec sock_sendmsg ([kernel.kallsyms])
ffffff80087df8a4 sock_write_iter ([kernel.kallsyms])
ffffff8008263728 __vfs_write ([kernel.kallsyms])
ffffff8008263a20 vfs_write ([kernel.kallsyms])
ffffff8008263c28 ksys_write ([kernel.kallsyms])
ffffff8008263ca8 __arm64_sys_write ([kernel.kallsyms])
ffffff80080949c8 el0_svc_common ([kernel.kallsyms])
ffffff8008094a54 el0_svc_compat_handler ([kernel.kallsyms])
ffffff8008082ff0 el0_svc_compat ([kernel.kallsyms])
10016 __libc_do_syscall (/lib/libpthread-2.27.so)
25 [unknown] ([unknown])
swapper 0 [006] 68874.894320: sched:sched_wakeup: comm=iperf pid=16111 prio=120 target_cpu=006
ffffff80080e7c48 ttwu_do_wakeup ([kernel.kallsyms])
ffffff80080e7c48 ttwu_do_wakeup ([kernel.kallsyms])
ffffff80080e1f20 ttwu_do_activate ([kernel.kallsyms])
ffffff80080e0c98 try_to_wake_up ([kernel.kallsyms])
ffffff80080e2170 wake_up_process ([kernel.kallsyms])
ffffff8008136f28 hrtimer_wakeup ([kernel.kallsyms])
ffffff8008136c78 __hrtimer_run_queues ([kernel.kallsyms])
ffffff8008136904 hrtimer_interrupt ([kernel.kallsyms])
ffffff80087481e0 arch_timer_handler_phys ([kernel.kallsyms])
ffffff800811d858 handle_percpu_devid_irq ([kernel.kallsyms])
ffffff8008118198 __handle_domain_irq ([kernel.kallsyms])
ffffff8008081164 gic_handle_irq ([kernel.kallsyms])
ffffff8008082bf0 el1_irq ([kernel.kallsyms])
ffffff8008086cd8 arch_cpu_idle ([kernel.kallsyms])
ffffff80080e9c3c do_idle ([kernel.kallsyms])
ffffff80080e9e10 cpu_startup_entry ([kernel.kallsyms])
ffffff80080936ac secondary_start_kernel ([kernel.kallsyms])
在perf工具不存在的情况下,也可以使用trace-cmd工具,使用方法:
localhost /log # trace-cmd record -e sched:sched_switch -e sched:sched_wakeup &
[1] 5199
localhost /log # vim trace.txt Hit Ctrl^C to stop recording
localhost /log # kill -2 5199 //5199为trace-cmd进程id
localhost /log # CPU0 data recorded at offset=0x1ea000
12939264 bytes in size
CPU1 data recorded at offset=0xe41000
7598080 bytes in size
CPU2 data recorded at offset=0x1580000
7344128 bytes in size
CPU3 data recorded at offset=0x1c81000
4849664 bytes in size
CPU4 data recorded at offset=0x2121000
20893696 bytes in size
CPU5 data recorded at offset=0x350e000
17412096 bytes in size
CPU6 data recorded at offset=0x45a9000
9584640 bytes in size
CPU7 data recorded at offset=0x4ecd000
11964416 bytes in size
[1]+ Done trace-cmd record -e sched:sched_switch -e sched:sched_wakeup
使用trace-cmd report解析结果。
在没有trace-cmd的情况下,可以使用linux自带的debugfs操作,如下:
cd /sys/kernel/debug/tracing
echo > set_event;echo 0 > trace;echo 20000 > buffer_size_kb;echo sched:sched_switch > set_event;echo sched_wakeup >> set_event;echo sched:sched_wait_task >> set_event
echo 0 > trace;echo 20000 > buffer_size_kb;
echo 1 > tracing_on;sleep 1;echo 0 > tracing_on
cat trace | head -20
# tracer: function_graph
#
# CPU DURATION FUNCTION CALLS
# | | | | | | |
58) | /* sched_wakeup: comm=kworker/u258:2 pid=179049 prio=120 target_cpu=107 */
107) | /* sched_switch: prev_comm=swapper/107 prev_pid=0 prev_prio=120 prev_state=R ==> next_comm=kworker/u258:2 next_pid=179049 next_prio=120 */
------------------------------------------
107) <idle>-0 => <...>-179049
------------------------------------------
107) | /* sched_wakeup: comm=sshd pid=150569 prio=120 target_cpu=117 */
107) | /* sched_switch: prev_comm=kworker/u258:2 prev_pid=179049 prev_prio=120 prev_state=I ==> next_comm=swapper/107 next_pid=0 next_prio=120 */
117) | /* sched_switch: prev_comm=swapper/117 prev_pid=0 prev_prio=120 prev_state=R ==> next_comm=sshd next_pid=150569 next_prio=120 */
------------------------------------------
117) <idle>-0 => <...>-150569
------------------------------------------
117) | /* sched_switch: prev_comm=sshd prev_pid=150569 prev_prio=120 prev_state=S ==> next_comm=swapper/117 next_pid=0 next_prio=120 */
58) | /* sched_wakeup: comm=kworker/u258:2 pid=179049 prio=120 target_cpu=107 */
----------------------------------
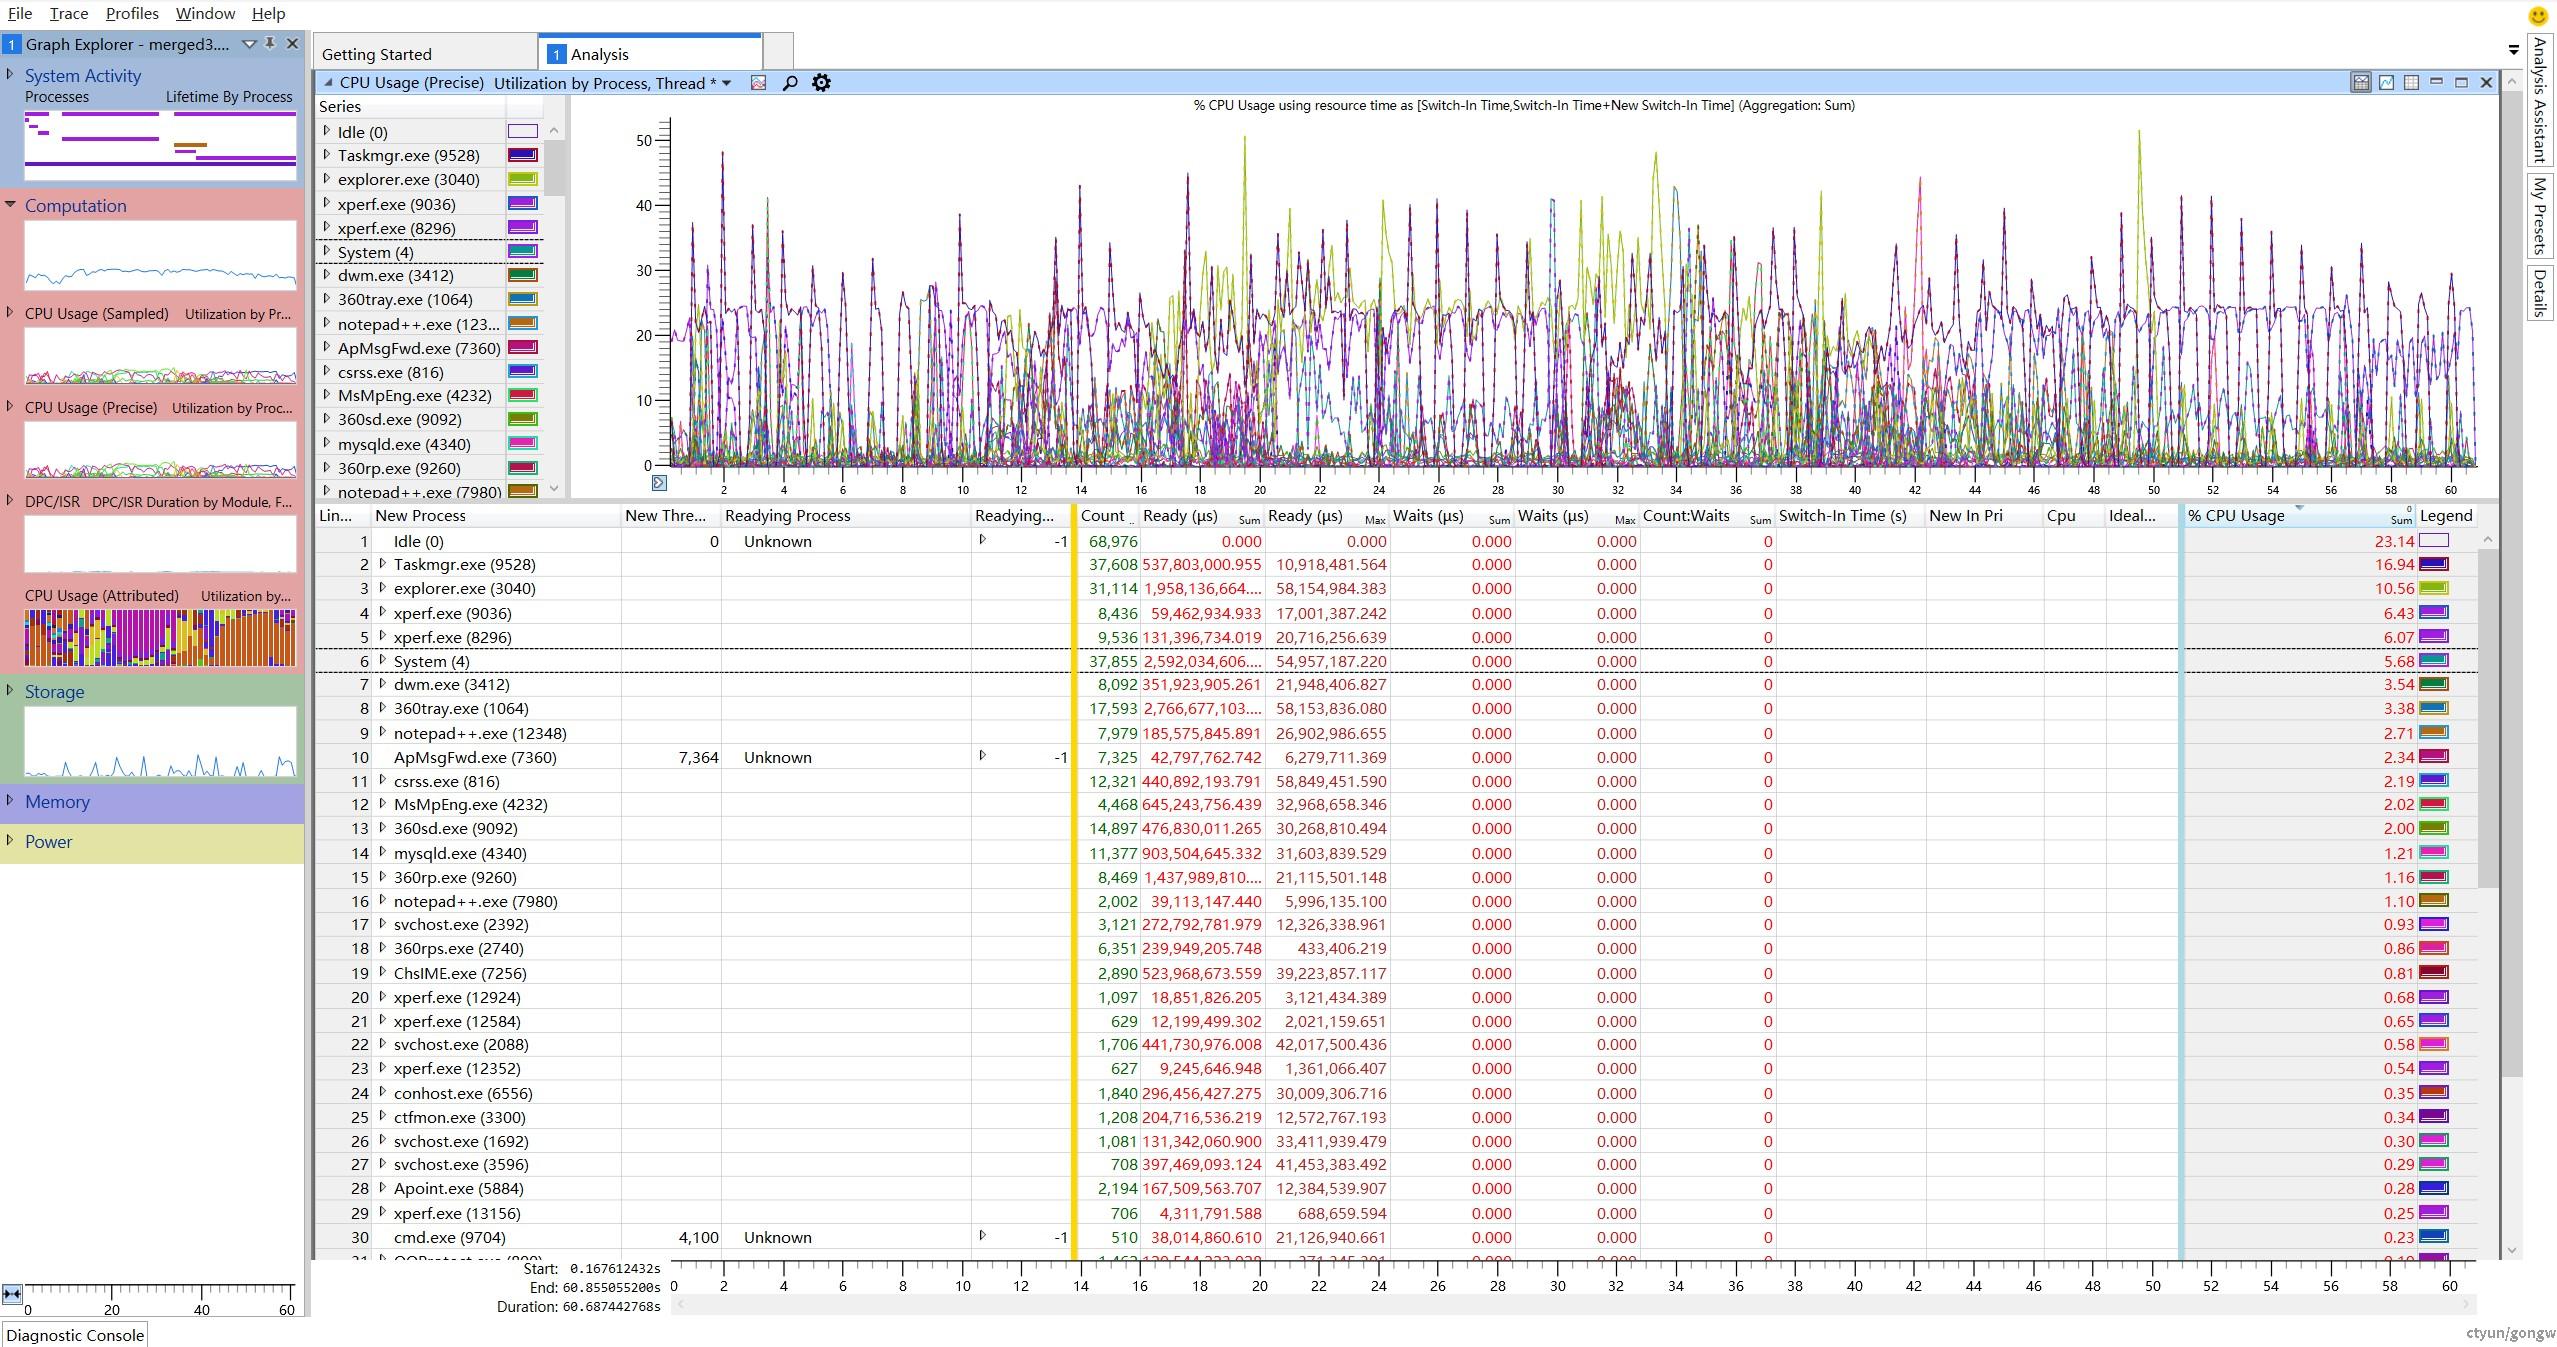
对于windows cpu/中断/DPC占用和线程调度等待唤醒,使用性能工具xperf和windows performance analyzer,如下所示: