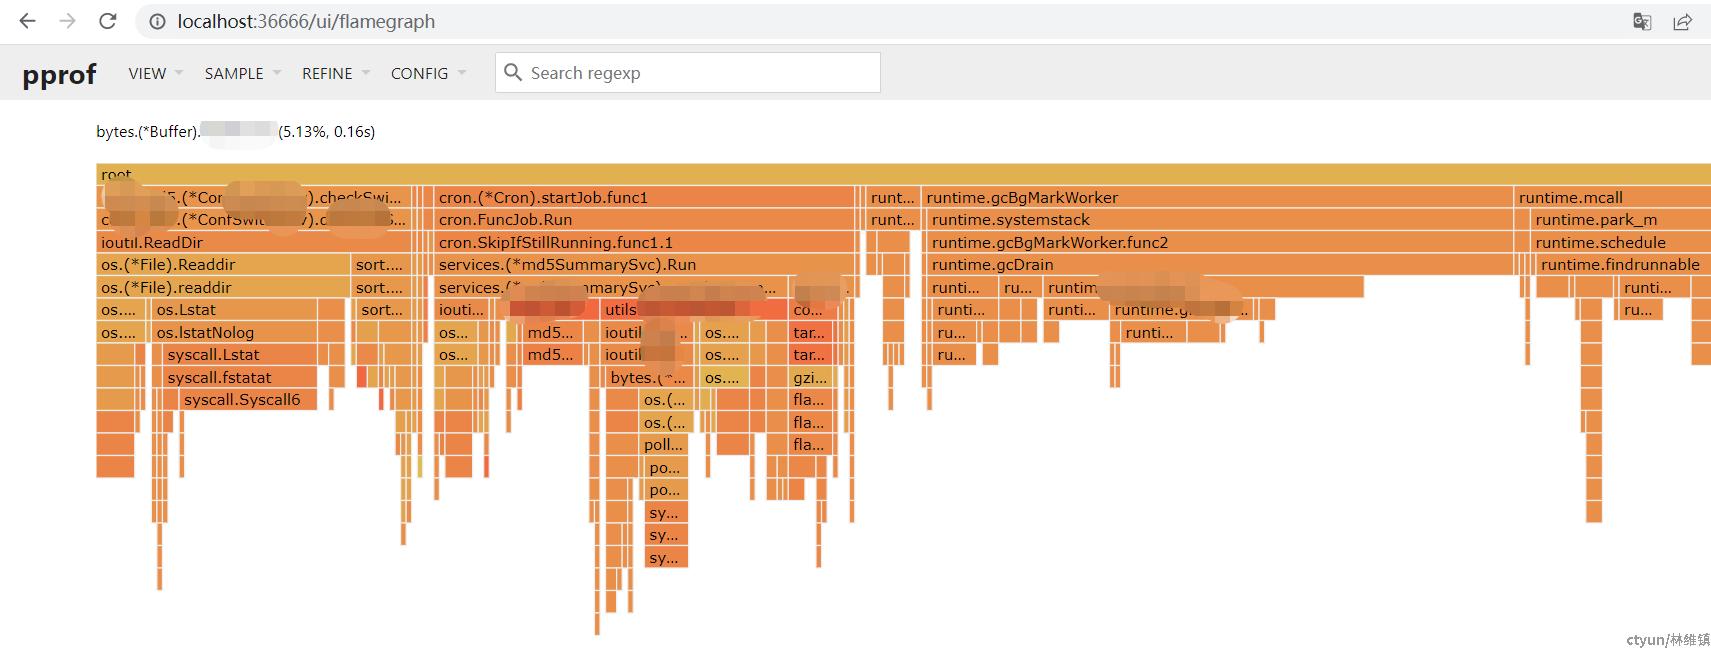
1、首先我们的服务需要打开pprof配置
		router := gin.Default()
		pprof.Register(router)
		mux.Handle("/", router)
2、生成profile文件
通过curl -o profile2 http://127.0.0.1:21111/debug/pprof/profile?debug=1
生成profile文件
3.通过go tool 工具生成分析图表
3.1 首先安装go的sdk
3.2 安装graphviz
https://graphviz.gitlab.io/_pages/Download/windows/graphviz-2.38.msi
设置到path环境变量中 D:\go\Graphviz2.38\bin
3.3 测试graphviz是否安装成功
C:\Users\Administrator>dot -version
dot - graphviz version 2.38.0 (20140413.2041)
libdir = "D:\go\Graphviz2.38\bin"
Activated plugin library: gvplugin_dot_layout.dll
Using layout: dot:dot_layout
Activated plugin library: gvplugin_core.dll
Using render: dot:core
Using device: dot:dot:core
The plugin configuration file:
        D:\go\Graphviz2.38\bin\config6
                was successfully loaded.
    render      :  cairo dot fig gd gdiplus map pic pov ps svg tk vml vrml xdot
    layout      :  circo dot fdp neato nop nop1 nop2 osage patchwork sfdp twopi
    textlayout  :  textlayout
    device      :  bmp canon cmap cmapx cmapx_np dot emf emfplus eps fig gd gd2 gif gv imap imap_np ismap jpe jpeg jpg metafile pdf pic plain plain-ext png pov ps ps2 svg svgz tif tiff tk vml vmlz vrml wbmp xdot xdot1.2 xdot1.4
    loadimage   :  (lib) bmp eps gd gd2 gif jpe jpeg jpg png ps svg
通过命令生成图表:
go tool pprof -http=:36666 d:\work\pprof\profile2
4.在生成图表的浏览器选择火焰图即可
